Understanding Your Power Curve: What It Says About You as a Cyclist
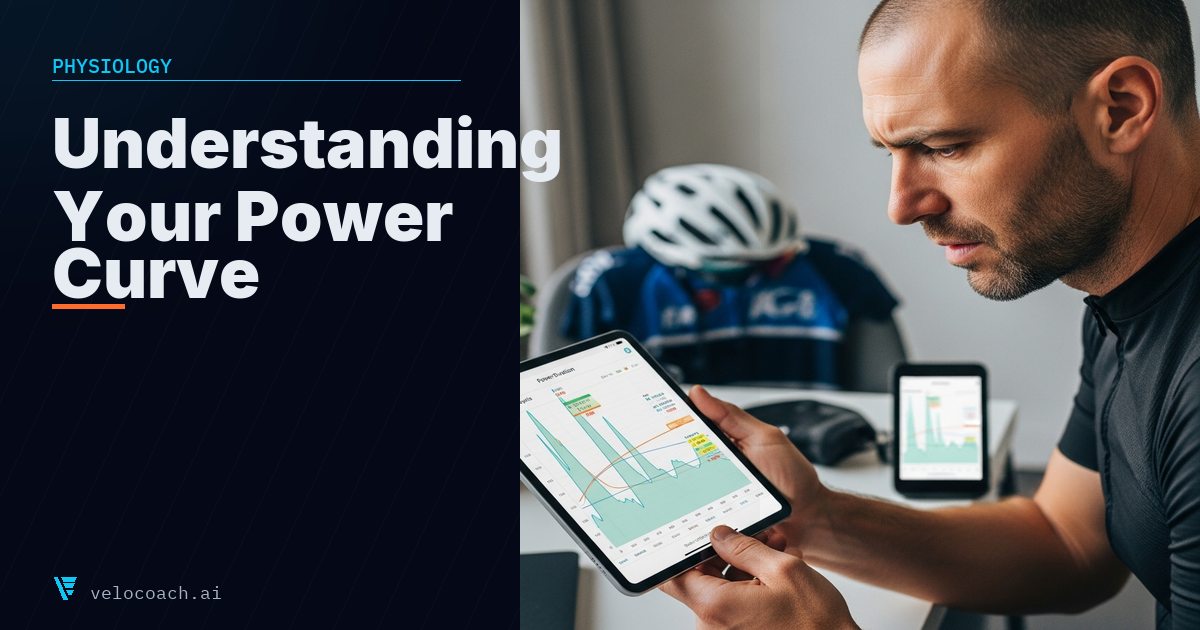
Your power curve (sometimes called the power duration curve or critical power curve) is one of the most information-dense outputs in cycling analytics. It shows your best average power for every duration from one second to multiple hours, plotted as a smooth curve across those time spans.
Most cyclists glance at peak power numbers occasionally and leave the rest of the curve unexplored. This is leaving a significant amount of useful self-knowledge on the table.
What the Power Curve Shows
At the far left of the curve: your neuromuscular peak power. The maximum watts you can produce for one to five seconds. This is almost entirely about fast-twitch muscle fibre recruitment and the phosphocreatine energy system.
Moving right to 30 seconds to two minutes: anaerobic capacity. Your ability to sustain very high power using anaerobic energy systems before fatigue forces reduction. Sprinters and criterium racers have high values here relative to their aerobic power.
At five to twenty minutes: your VO2 max power. The highest average power you can sustain for efforts in this range corresponds closely to your maximal aerobic power. Well-trained cyclists have higher relative values in this range than the anaerobic-dominant profile.
At 20 to 60 minutes: FTP territory. Your threshold power and sustained aerobic capacity. The flattest part of most curves.
Beyond 60 minutes: durability and fatigue resistance. How well your power holds relative to shorter efforts as duration extends. Athletes with strong aerobic bases often show relatively high power at two to four hours compared to their 20-minute power.
What Your Curve Shape Tells You
The shape of your power curve reveals your physiological profile:
Steeply declining from short to long durations: High anaerobic capacity, lower aerobic power. This profile characterises sprinters, track cyclists, and athletes who are good in short, explosive situations but suffer in sustained climbing or long time trials.
Relatively flat from 5 minutes to 60 minutes: Strong aerobic engine with good threshold relative to VO2 max. This profile characterises climbers and time trialists who can sustain high power for extended periods.
All-rounder: A balanced curve without extreme differences between the sprint and endurance sections. Most well-rounded road cyclists have a roughly balanced profile.
Understanding your profile tells you two things: where your current strengths lie, and where training investment will produce the most return for your specific racing or event goals.
How to Use Your Power Curve for Training
Identify weaknesses relative to your goals. If you are targeting criterium racing and your five-second power is lower than expected for your FTP, neuromuscular training deserves attention. If you are targeting a mountain sportive and your two-hour power drops disproportionately relative to your one-hour power, durability training (long Zone 2 rides, prolonged sweet spot) is the priority.
Track improvement over time. The power curve should be shifting up and right over a well-structured training season. All-time bests at key durations (one minute, five minutes, 20 minutes, 60 minutes) mark the ceiling of your training progress.
Spot gaps after training blocks. After a VO2 max block, your five-to-eight-minute power should have improved. After a threshold block, your 20-to-60-minute power should have improved. After a neuromuscular block, your one-to-ten-second power should have improved. If the curve has not shifted in the segment corresponding to your training emphasis, the training was not producing the intended adaptation.
Calibrate FTP more accurately. Looking at your 20-minute, 30-minute, and 60-minute best power, rather than relying on a single test, gives a more complete picture of where your threshold actually sits and reduces the risk of a bad test day distorting your training zones.
What Limits the Power Curve's Usefulness
The power curve is only as reliable as the data in it. It requires maximum efforts at multiple durations to be accurate. An athlete who has never produced a genuine all-out 20-minute effort will show an artificially low value in that range that does not reflect their actual capacity.
Similarly, the power curve reflects your best efforts under the conditions of each ride: temperature, fatigue level, terrain, and motivation all affect any given session's output. The curve improves in accuracy as data accumulates over multiple months of training.
Freshness matters. The best values on your power curve were almost certainly produced on days when your Form was positive or near zero. Power curve values produced in a deeply negative Form state do not reflect your actual capacity and should not be used to set training targets.
Durability: The Underappreciated Curve Component
One of the most practically useful insights the power curve offers is durability: how well your power at longer durations holds relative to your power at shorter durations.
An athlete who can produce 300W FTP but whose three-hour average power is only 230W has lower durability than one who averages 260W for three hours. The three-hour power matters more than the FTP in most sportives, gran fondos, and long road races.
Durability is built through high-volume Zone 2 training and extended sweet spot rides. Athletes who prioritise interval work at the expense of long rides often develop strong FTP numbers but poor durability. The power curve makes this imbalance visible.
---
Train with a coach that reads your data
VeloCoach AI connects to Garmin, Wahoo, Intervals.icu and Apple Health, and tells you exactly what to do next.
Download on the App Store