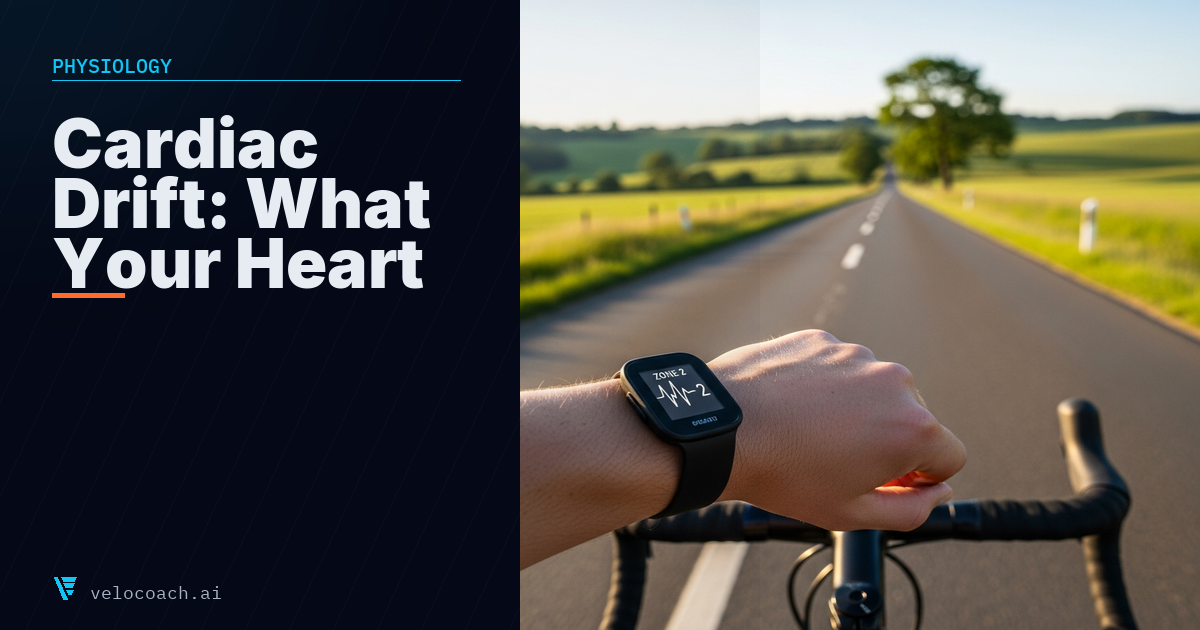
Cardiac Drift and Aerobic Decoupling: What Your Heart Rate Is Telling You About Your Fitness
Cardiac drift is the slow rise in your heart rate during a long, steady ride, even though your power stays the same. On a 90-minute easy ride, a well-trained cyclist usually sees aerobic decoupling (the measure of that drift) under 5%. Around 10% or more means the aerobic base needs more time, the ride was harder than it felt, or heat, dehydration or low fuel pushed it up.
There is a metric buried in your ride data that most cyclists never look at, and it tells you more about the state of your aerobic fitness than almost any other single number. It is called aerobic decoupling, and it is visible in every ride that includes both power and heart rate data.
What Cardiac Drift Is
During sustained exercise at constant power, heart rate does not remain constant. It rises slowly over the course of the effort, even when the work you are doing is not increasing. This phenomenon is cardiac drift.
The mechanism is physiological: as you exercise, blood plasma volume decreases slightly through sweating and fluid redistribution. With less blood volume, each heartbeat moves slightly less oxygen. To maintain the same output, the heart must beat faster. Additionally, rising core temperature, hormonal changes, and progressive muscular fatigue all contribute to a gradual increase in heart rate at a given power over time.
In a well-trained cyclist with good aerobic fitness, cardiac drift during a Zone 2 effort of 90 minutes is small: perhaps 3 to 5 beats per minute over the course of the ride. In a less fit cyclist, or one carrying significant fatigue, drift at the same relative intensity can be 10 to 15 beats.
Aerobic Decoupling as a Fitness Metric
Aerobic decoupling is the quantified expression of cardiac drift. It compares the relationship between power and heart rate in the first half of a ride to the relationship in the second half.
If power is identical across both halves and heart rate is higher in the second half, the ratio of power to heart rate has declined. A decoupling of less than 5% is generally considered excellent aerobic fitness. Decoupling of 10 to 15% indicates developing aerobic base that needs more time. Decoupling above 20% suggests either poor aerobic base, inadequate fuelling, or significant fatigue.
A worked example. Split a steady 90-minute ride into two 45-minute halves. In the first half you average 180 watts at 130 bpm, which is 1.385 watts per beat. In the second half you hold the same 180 watts, but your heart rate has crept up to 137 bpm: 1.314 watts per beat. The drop from 1.385 to 1.314 is 5.1%, so the ride's decoupling is about 5%, at the edge of excellent. Use only the steady part of the ride: leave out the warm-up, stops and any hard efforts, or the number means little.
The metric is most useful when tracked over time during the base-building phase. A useful weekly test: complete a 90-minute Zone 2 ride and record the decoupling. Over a 12 to 16-week base phase, you should see decoupling gradually reduce as your aerobic base develops and your heart becomes more efficient at delivering oxygen to working muscles at a given intensity.
A 2025 study using machine learning to analyse cardiovascular drift in cyclists found that the models achieved 87 to 90% accuracy in classifying athletes as "aerobic responders" to training based on drift patterns alone. The research confirmed what coaches have known empirically: cardiac drift is a reliable, real-time indicator of aerobic fitness development.
How to Use Decoupling Practically
Assess aerobic fitness without a formal test. Rather than waiting for an FTP ramp test to assess fitness, track your decoupling on regular Zone 2 rides. If your 90-minute Zone 2 ride shows consistently declining decoupling over three months, your aerobic base is building.
Identify rides where fatigue is impairing performance. If you feel fine but your decoupling on what should be an easy Zone 2 ride is unusually high, your body is working harder than the power number suggests. This is often an early sign of accumulated fatigue or oncoming illness.
Check that easy rides are actually easy. Athletes who drift into Zone 3 on supposedly easy rides often show very high decoupling because the intensity is enough to cause progressive cardiovascular strain. If your 90-minute "easy" ride shows 15% decoupling, it was not Zone 2.
Time your training camp or block. Before a training camp or hard training block, track your decoupling to confirm your aerobic base is solid enough to support the increased load. High decoupling suggests insufficient base and higher risk of non-functional overreaching during a sudden load increase.
The Relationship With Hydration and Heat
Cardiac drift is exacerbated by dehydration and heat. As fluid is lost through sweat, blood volume decreases, increasing the drift rate at any given intensity. This means rides in hot conditions will always show higher decoupling than comparable cool-weather rides, independent of fitness level.
When interpreting decoupling data, control for conditions where possible. Compare zone 2 rides done in similar temperature and humidity, and note when weather is unusually hot so you do not misinterpret elevated decoupling as fitness regression.
Similarly, inadequate fuelling during longer rides increases cardiac drift as glycogen depletion forces the cardiovascular system to work harder for the same power output. Rides where you run low on fuel show artificially high decoupling that should not be counted as a true fitness metric.
Aerobic Efficiency Factor
Related to decoupling is the Aerobic Efficiency Factor (EF): the ratio of average power to average heart rate across a ride. EF increases as aerobic fitness improves, because a fitter athlete produces more power at the same heart rate.
Tracking EF over a base-building phase shows the same trend as decoupling. A consistently rising EF across weeks of Zone 2 training confirms that the aerobic system is developing. Stagnant or declining EF despite consistent training suggests a training or recovery problem worth investigating.
Both metrics together (decoupling and EF) give a clearer picture of aerobic development than any single test, because they are produced from regular training rides rather than special testing protocols.
---
Train with a coach that reads your data
VeloCoach AI connects to Garmin, Wahoo, Intervals.icu and Apple Health, and tells you exactly what to do next.
Download on the App Store