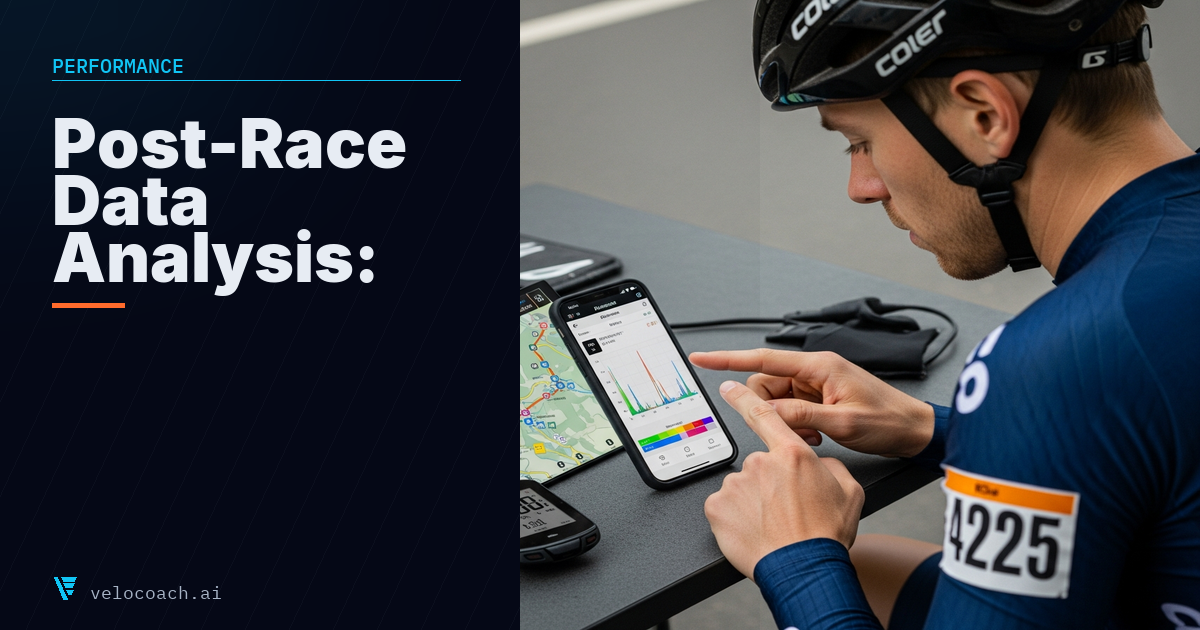
Post-Race Data Analysis: What to Look For After an Event
Uploading your race file and staring at the power trace is satisfying, but most cyclists do not know what to actually look for. A race file contains far more than a peak power number and a headline average. Analysed correctly, it tells you why you performed the way you did, where specifically you lost or gained time, and what training to prioritise before the next event.
Start With the Questions
Before drilling into the data, write down three things: what went well, what did not go well, and the moment or section that you feel determined the outcome. Then use the data to either confirm or challenge your subjective impression. The combination of felt experience and data is more valuable than either alone.
Common mismatches: a rider who feels they "gave up" in the final 10km often finds their power data shows they were riding at or above target power throughout. The feeling of giving up was fatigue-induced perception, not actual effort reduction. Conversely, a rider who feels they rode well through a climb but finished slower than expected often finds they went 15% above sustainable power in the first three minutes of the climb and paid for it afterward.
Power Distribution Analysis
The first analytical step is to review your power distribution over the race. Strava, TrainingPeaks, and similar platforms show this as a histogram of time spent at each power output.
What healthy distribution looks like for a road race: Most time at low-to-moderate power (following wheels in the bunch), with meaningful time at or above FTP (attacks, climbs, surges) and a smaller amount at near-maximal and maximal power (sprint, hard attack efforts).
Red flags in the distribution:
Too much time above FTP too early in the race suggests you spent energy in the first half that compromised your capacity in the second. Look at which section this corresponds to using the time-synced power graph.
Very little time above threshold in a race where you expected to be competitive may indicate you were dropped before the race reached its decisive moments, or that your race position never required high-intensity efforts.
Pacing by Segment
Break the race into meaningful segments: the opening neutral section, major climbs, the descent after a climb, the flat sections, and the finale. Look at average power and weighted power for each segment.
Weighted power is more useful than average power for variable efforts because it reflects the metabolic cost of the effort. A flat average power can mask a highly variable effort (attacks and soft-pedalling) that is physiologically much harder than the average suggests.
If you faded in the final third of the race: Identify which section preceded the fade and whether your power was significantly above target there. This is almost always the cause of a late-race fade.
If you were dropped on a specific climb: Review your power relative to FTP on that climb. If you were above 110% of FTP for more than 2 to 3 minutes before being dropped, the climb exceeded your current capacity. If you were at or below 100% of FTP when dropped, something else (positioning, poor wheel choice, tactical error) rather than physiology dropped you.
Heart Rate Analysis
The power trace tells you what work you did. Heart rate tells you the cardiovascular cost of that work. Comparing the two reveals useful information.
High heart rate at moderate power: Suggests fatigue, dehydration, or heat, all of which elevate heart rate at a given power output. If your heart rate was higher than expected relative to the power you were producing, one of these factors was likely limiting.
Heart rate failing to reach expected levels at high power: Sometimes indicates the cardiovascular system was not adequately stressed, which may mean the race was not as hard as it felt, or that cardiac output was somehow limited. More commonly, this simply reflects the transient nature of short, maximal efforts where heart rate lags behind the actual effort.
Cardiac drift: Review your heart rate trend across the race. If heart rate climbed steadily relative to power as the race progressed, this is cardiovascular drift, indicating dehydration or accumulated fatigue impairing cardiovascular efficiency. Compare the power-to-heart rate ratio in the first and second half of the race.
Identifying Tactical Moments
Most race platforms allow you to annotate your power trace and compare against GPS data. Use this to identify specific tactical moments:
Where were attacks and surges? A sharp power spike followed by a significant drop is the signature of an attack response. How many of these were there? Were you still producing reasonable power after each response, or were responses causing you to go into negative recovery?
Where did the race break open? The moment a breakaway went or the bunch split usually corresponds to a section where sustained power was unusually high. If you were not in the right position at this moment, it may appear in your data as a gap between your power and what was required to follow.
Was your sprint actually your best effort? If you have sprint power data from training, compare your race sprint to training sprints. Athletes often under-sprint in races due to accumulated fatigue. If your race sprint was significantly below training sprint power, this tells you either you arrived at the sprint too fatigued or your neuromuscular system was not fully engaged.
Training Implications
Post-race data should feed directly into your next training priorities.
If you were dropped on climbs: W/kg is the limiter. Either improve FTP, reduce weight, or both.
If you could not respond to repeated attacks: Anaerobic capacity and recovery from hard efforts is the limiter. Work on short VO2 intervals with insufficient recovery, or criterium-specific repeated sprint protocols.
If you faded in the final hour of a long race: Durability is the limiter. Increase long ride volume and include extended sweet spot efforts on long rides.
If your sprint was poor despite fresh legs: Neuromuscular training (sprints, track, heavy gym work) is the priority.
---
Train with a coach that reads your data
VeloCoach AI connects to Garmin, Wahoo, Intervals.icu and Apple Health, and tells you exactly what to do next.
Download on the App Store